
Prop Firm Consistency Rules Explained: How to Calculate Your Consistency Score
On this page
- What a prop firm consistency rule is
- Why some prop firms use consistency rules
- How the consistency percentage is calculated
- Mode A: Profit Target Based
- Mode B: Net Profit Based
- The same data gives two different answers
- Strictly below vs at or below
- How additional profit required is estimated
- How negative and zero-profit days affect the numbers
- How to use the calculator, step by step
- Entering daily P&L: manual, paste and CSV
- Common calculation mistakes
- Important assumptions and limitations
- Frequently asked questions
- Related guides and tools
What a prop firm consistency rule is
A prop firm consistency rule is a condition that some proprietary trading firms attach to an evaluation or a funded account. It limits how much of your profit may come from a single day. In practice, the firm takes your most profitable day, compares it with a reference amount, and checks that the result stays within a set percentage, such as 20%.
The idea is easy to state, but the details are not standard. Firms differ in which reference amount they use, which percentage applies, whether the limit is strict or inclusive, which accounts and phases the rule covers, and how a “day” is defined. This guide explains the two calculation methods that the Prop Firm Consistency Calculator supports and the two ways of treating a score that lands exactly on the limit. It does not describe any particular firm’s rules. For those, read your firm’s own current terms.
Why some prop firms use consistency rules
Firms that use consistency rules often describe the aim as rewarding steady results rather than a single outsized day. The reasoning varies, but a common thread is that one very large day can reflect luck or unusually heavy risk, so a rule that caps its share of the total is meant to favour repeatable behaviour. Whether a firm uses such a rule, and how it explains it, is the firm’s own choice. Treat this as general background, not as a statement about any specific firm.
For you as a trader, the practical point is simpler: the rule puts a ceiling on your best day relative to some reference amount. It helps to know where that ceiling sits before a big day happens, not after.
How the consistency percentage is calculated
Every consistency score has the same shape:
Consistency score = Highest profit day ÷ Reference amount × 100Best-day line = Reference amount × Consistency limit
- Highest profit day is the largest positive net P&L on a single day. A day is one calendar day of net P&L; the calculator adds rows that share a date into one day by default. Losing days and zero-profit days are never the highest profit day. If no day has a profit, there is no highest profit day and no score.
- Reference amount is what the rule divides by. The two methods below differ only here.
- Consistency limit is the percentage the score is compared with. In the calculator it must be above 0 and no more than 100.
- Best-day line is the reference amount multiplied by the limit. It is the amount your best day is compared with, and it is called the Maximum allowed best day in the calculator when the rule is “at or below”.
Because a firm’s wording decides whether landing exactly on the limit passes, the comparison itself has two versions. They are covered in the strictly below vs at or below section.
Mode A: Profit Target Based
In Profit Target Based mode, the reference amount is the profit target. The calculator’s default mode uses these formulas:
Consistency score = Highest profit day ÷ Profit target × 100Maximum allowed best day = Profit target × Consistency limit
The denominator is fixed. Adding profit on other days does not change the score, because the target does not move.
Worked example. Profit target $5,000, highest profit day $700, consistency limit 20%.
- Consistency score = 700 ÷ 5,000 × 100 = 14%
- Maximum allowed best day = 5,000 × 20% = $1,000
- Room under the line = $1,000 − $700 = $300
Under an at-or-below rule, a best day up to and including $1,000 meets the limit. Under a strictly-below rule, the best day must be below $1,000. A $700 best day is within the limit under either wording. If the best day had been $1,200, the score would be 24%, which is $200 above the line and over the limit.
“Profit target” here means whatever amount your firm’s rule uses as the denominator for your account. Check which amount that is in your firm’s terms.
Mode B: Net Profit Based
In Net Profit Based mode, the reference amount is your total net profit so far. This mode needs your daily results, because the net profit is their sum:
Net profit = Sum of daily P&LConsistency score = Highest profit day ÷ Net profit × 100Maximum allowed best day = Net profit × Consistency limitRequired total net profit = Highest profit day ÷ Consistency limitAdditional profit required = Required total net profit − Current net profit (none if already met)
Worked example. Five days of net P&L with a 20% limit:
| Day | Net P&L | Running net profit |
|---|---|---|
| 1 | $500 | $500 |
| 2 | $300 | $800 |
| 3 | −$100 | $700 |
| 4 | $700 (highest) | $1,400 |
| 5 | $200 | $1,600 |
- Net profit = 500 + 300 − 100 + 700 + 200 = $1,600
- Highest profit day = $700 (day 4)
- Consistency score = 700 ÷ 1,600 × 100 = 43.75%
- Maximum allowed best day at the current net profit = 1,600 × 20% = $320, so the $700 best day is $380 above the line
- Required total net profit = 700 ÷ 0.20 = $3,500
- Additional profit required = 3,500 − 1,600 = $1,900
Under an at-or-below rule, that means net profit of at least $3,500, so at least $1,900 more. Under a strictly-below rule it means net profit greater than $3,500, so more than $1,900 more. Both wordings give the same score and the same status here: the best day is above the limit. The reason for the “at least” versus “more than” difference is explained in the strictly below vs at or below section.
Because net profit is the denominator, anything that changes net profit changes the score. That includes extra profit on other days (which lowers the score) and losing days (which raise it).
The same data gives two different answers
The two modes answer different questions, so the same five days produce different scores. With a $5,000 profit target, the $700 best day scores 14% in Mode A and 43.75% in Mode B:
| Mode A: Profit Target Based | Mode B: Net Profit Based | |
|---|---|---|
| Denominator | $5,000 profit target | $1,600 net profit |
| Consistency score | 14.00% | 43.75% |
| Best-day line | $1,000 | $320 |
| Result | $700 is $300 below the line: Within Limit | $700 is $380 above the line: Above Limit |
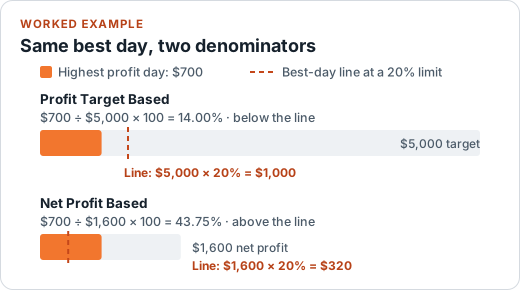
Neither mode is “right” in general. Which one applies depends entirely on the wording of your firm’s rule. This is also why you should never compare a score from one mode with a limit written for the other. The chart below puts both lines on the same five days:
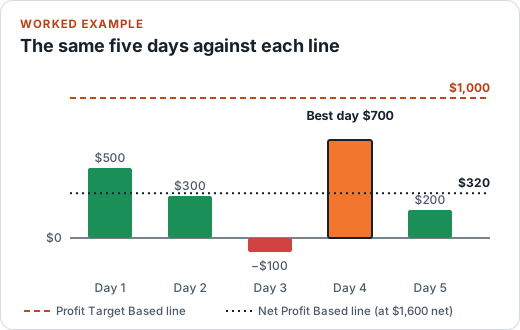
Strictly below vs at or below
Separately from the formula, rules differ in how they treat a score that lands exactly on the limit. The calculator asks you to choose, because the two readings are not interchangeable:
- Strictly below the limit: the score must be less than the limit. A score equal to the limit does not pass.
- At or below the limit: the score may be less than or equal to the limit. A score equal to the limit passes.
Take a 20% limit on a $5,000 profit target. The line is $1,000, and these best days give these scores:
| Best day | Score | Strictly below | At or below |
|---|---|---|---|
| $999.50 | 19.99% | Pass | Pass |
| $1,000.00 | 20.00% | Fail (At Limit) | Pass |
| $1,000.50 | 20.01% | Fail | Fail |
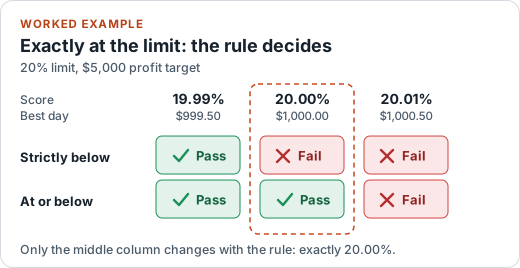
Why exactly 20.00% fails under a strict rule but passes under an at-or-below rule
A strictly-below rule asks “is the score less than 20%?”. A score of exactly 20.00% is equal to 20%, not less than it, so the answer is no. An at-or-below rule asks “is the score less than or equal to 20%?”. Equality satisfies that, so the answer is yes. The calculator labels the strict case At Limit — does not pass so it is not mistaken for an ordinary failure.
The same distinction carries into every number that depends on the limit:
| Strictly below | At or below | |
|---|---|---|
| Pass condition | Score < limit | Score ≤ limit |
| Best day compared with the line | Must be below the line | May be equal to or below the line |
| Mode B net profit needed | Greater than highest day ÷ limit | At least highest day ÷ limit |
| Mode B additional profit | More than the amount shown | At least the amount shown |
Mode A example at the limit. Target $5,000, best day $1,000, limit 20%: the score is exactly 20.00%. An at-or-below rule gives Within Limit. A strictly-below rule gives At Limit — does not pass.
Mode B example at the limit. Five days of $700 each give net profit $3,500 and a best day of $700, so the score is 700 ÷ 3,500 = exactly 20.00%. At or below: Within Limit, nothing more needed. Strictly below: At Limit — does not pass, and any further profit that keeps the best day unchanged would bring the score under the limit.
This is also why the calculator never presents the exact boundary amount as a passing target under a strict rule. It tells you the amount must be exceeded, and it does not invent a minimum step, because currencies and firms handle precision differently. The calculator compares exact amounts, so a score slightly different from the limit is never rounded into a pass or a fail. When a score is very close to the limit but not equal, it shows extra decimals (for example 19.9998%) instead of printing 20.00%.
How additional profit required is estimated
In Net Profit Based mode, the calculator estimates how much more net profit you would need for your current highest profit day to fit within the limit:
Required total net profit = Highest profit day ÷ Consistency limitAdditional profit required = Required total net profit − Current net profit
If current net profit already meets the requirement, the result is “None needed”. Otherwise it is “at least” the shortfall under an at-or-below rule, or “more than” the shortfall under a strictly-below rule.
This is an estimate with an assumption. It assumes any future profit arrives on days that are no larger than your current highest profit day. If a new highest profit day occurs, the required total changes and you must recalculate. Using the five-day example (net profit $1,600, best day $700, limit 20%, at-or-below):
- Today: required total = 700 ÷ 0.20 = $3,500, so at least $1,900 more.
- Next day makes $300 (below the $700 best day): net profit is $1,900, the best day is still $700, and the requirement is still $3,500, so at least $1,600 more. The estimate held, and you moved closer.
- Next day makes $900 (a new best day): net profit is $2,500, but the best day is now $900, so the requirement becomes 900 ÷ 0.20 = $4,500 and at least $2,000 more is needed. The target moved away from you, and the score is 36.00%.
Under a strictly-below rule, the same figures read “more than $1,900”, “more than $1,600” and “more than $2,000”. Treat the number as a snapshot of the current data, not a forecast or a plan.
How negative and zero-profit days affect the numbers
Using the five-day example in Net Profit Based mode (20% limit, at-or-below):
| Change to the data | Net profit | Highest day | Score | Additional profit (at or below) |
|---|---|---|---|---|
| Original five days | $1,600 | $700 | 43.75% | At least $1,900 |
| Remove the −$100 day | $1,700 | $700 | 41.18% | At least $1,800 |
| Add a −$400 day | $1,200 | $700 | 58.33% | At least $2,300 |
| Add a $0 day | $1,600 | $700 | 43.75% | At least $1,900 |
- Losing days are never the highest profit day. In Mode B they reduce net profit, which makes the same best day a larger share and raises the score. In Mode A they do not change the score, because the denominator is the profit target (adding the −$400 day leaves the Mode A score at 14%).
- Zero-profit days count as days and appear as flat marks on the chart, but they add nothing to net profit and are never the highest day. They leave both scores unchanged.
- Zero or negative net profit. If daily results of $500 and −$500 net to $0, or $500 and −$900 net to −$400, a meaningful positive-profit consistency percentage cannot be calculated. The calculator shows Cannot Calculate instead of a number, and it does not show a pass.
- No profitable day. If every day is zero or negative there is no highest profit day, so there is nothing to test.
How to use the calculator, step by step
- Open the Prop Firm Consistency Calculator. It opens with five sample days so the result card is never blank. Use Clear all before entering your own.
- Choose the formula your firm’s rule describes: Profit Target Based (the default) or Net Profit Based.
- Enter the consistency limit as a percentage above 0 and up to 100.
- Choose whether the rule says the best day must be strictly below the limit or at or below it.
- In Profit Target Based mode, enter the profit target. If you only know your highest profit day, choose “I’ll enter my highest day” and type it in; the daily list and the chart are then not used.
- Add your daily P&L by hand, by pasting, or by importing a CSV file (see the next section).
- Read the result: the status (Within Limit, Above Limit, At Limit — does not pass, or Cannot Calculate), the consistency score, the highest profit day, total net profit, the best-day line, the difference from the limit and, in Net Profit Based mode, the additional profit required.
- Check the chart. It draws one bar per day, highlights the highest profit day, and draws a dashed line labelled “Must be below” (strict) or “Max allowed” (at or below). A text summary and a data table sit under it.
The calculator checks only the consistency formula you choose. It does not know your firm’s other requirements.
Entering daily P&L: manual, paste and CSV
Enter one net P&L figure per day: profits as positive numbers, losses as negative numbers, and flat days as zero. Dates are optional.
Manual entry
On the Manual tab, type the day’s net P&L (and a date if you like), then press Add day or the Enter key. Each row in the list can be edited in place or removed.
Paste multiple rows
On the Paste tab, paste one value per line, or date, value pairs such as 2026-11-04, 700. Several values can share a line if you separate them with a comma and a space, a semicolon or a tab. If your numbers use a decimal comma (1.234,56) switch the number format. Choose Preview import, fix or remove any rows flagged as invalid, then choose to replace or add to your current days.
Import a CSV file
On the CSV file tab, choose a file with a date column and a net P&L column, for example:
Date,Net P&L2026-11-01,5002026-11-02,3002026-11-03,-1002026-11-04,7002026-11-05,200
The calculator detects the separator, the header row and the two columns, and you can change any of them. A preview shows every row, where you can edit values, remove rows or fix errors before importing.
- Dates in YYYY-MM-DD form are shown as “Nov 4”. Other date text is kept as a plain label. Rows that share the same date are treated as one calendar day and combined by default; untick Combine rows that share a date to keep them separate. A note tells you when rows were combined.
- Limits. The calculator handles up to 1,000 days and CSV files up to 2 MB. If a file is larger, it warns you first, and importing only part of it is a separate, explicit choice because a partial import can change your highest profit day.
- Privacy. CSV files and pasted values are processed entirely in your browser. They are not uploaded, and no account is needed.
Common calculation mistakes
- Using the wrong denominator. Dividing by net profit when your firm’s rule uses the profit target, or the reverse, gives a completely different score (14% and 43.75% for the same data).
- Assuming one formula for every firm. Rules differ. Use the wording in your own firm’s terms.
- Treating exactly the limit as a pass under a strict rule. A score of exactly 20.00% fails a strictly-below rule.
- Expecting extra profit on other days to fix a Profit Target Based score. The denominator is the target, so it will not change.
- Reading “more than” as a fixed number. Under a strictly-below rule the additional profit must exceed the figure shown. Do not add an arbitrary amount and call it enough.
- Forgetting that a new best day moves the finish line. The additional-profit estimate must be recalculated after any new highest profit day.
- Counting two sessions on the same date as separate days, or mixing time zones, when your firm treats them as one day.
- Entering trades instead of daily totals. The calculator expects one net figure per day.
- Mixing costs inconsistently. Check whether your firm measures results before or after costs, and enter figures the same way for every day.
- Leaving the sample data in place and reading a result that is not about your account.
Important assumptions and limitations
- Prop firm rules differ. Firms differ in formula, percentage, strict or inclusive wording, accounts and phases, and rules can change. Verify your own firm’s official, current rules. This calculator does not know them and nothing here describes any specific firm.
- The two modes use different denominators. Mode A divides by the profit target and Mode B divides by net profit. Pick the one that matches your firm’s rule and do not mix them.
- The additional-profit estimate assumes future profits do not exceed the current highest profit day. If a new highest day occurs, recalculate.
- Zero or negative net profit. A meaningful positive-profit consistency percentage cannot be calculated, so the calculator shows Cannot Calculate.
- A day is assumed to be one calendar day of net P&L. Firms may define the day, the time zone, or even the unit (for example a single trade) differently.
- Consistency is only one possible requirement. A firm may also have profit targets, loss limits or other conditions. The calculator checks none of them.
- Not a guarantee. The calculator is an educational planning tool. It does not guarantee that you will pass an evaluation or meet payout requirements.
Frequently asked questions
What is a prop firm consistency score?
It is your highest profit day divided by a reference amount, multiplied by 100. Which reference amount is used depends on the firm’s rule: some use the profit target, others use total net profit. The score is then compared with a percentage limit, such as 20%.
Do all prop firms use the same consistency rule?
No. Firms differ in whether they use a consistency rule at all, which formula they use, the percentage limit, whether the limit is strict or inclusive, and which accounts or phases it applies to. This guide explains the calculation methods; it does not describe any particular firm’s rules, so always check your firm’s current official terms.
Which calculation mode should I choose?
Choose the one that matches the wording of your own firm’s rule. Profit Target Based divides by the profit target; Net Profit Based divides by your total net profit. The calculator cannot tell which one your firm uses.
Why does exactly 20.00% fail under a strictly-below rule but pass under an at-or-below rule?
A strictly-below rule requires the score to be less than the limit, and 20.00% is equal to 20%, not less than it. An at-or-below rule requires the score to be less than or equal to the limit, and equality satisfies that. The calculator shows At Limit — does not pass for the strict case.
Why does the additional profit say “more than” for a strictly-below rule?
Because reaching the break-even amount exactly produces exactly the limit, which a strictly-below rule does not accept. Net profit must be greater than that amount, so the additional profit must be more than the figure shown. Under an at-or-below rule, reaching it is enough, so the figure is “at least”. The calculator does not assume any minimum step beyond that.
Can a losing day change my consistency score?
In Profit Target Based mode, no: the denominator is the profit target. In Net Profit Based mode, yes: a loss lowers total net profit, which raises the score because the same best day becomes a larger share. A day with zero profit does not change net profit, so it does not change the score.
What if my net profit is zero or negative?
In Net Profit Based mode a meaningful positive-profit consistency percentage cannot be calculated, so the calculator shows Cannot Calculate rather than a misleading score. The same applies if no day has a profit.
Is my trading data uploaded when I use the calculator?
No. Calculations, pasted values and CSV files are processed in your browser. Your P&L data is not sent to a server and is not saved, so it is gone when you close or refresh the page.
Does a Within Limit result mean I will pass my evaluation or get paid?
No. The calculator is an educational planning tool that checks one rule using the numbers you enter. Firms have other requirements, their rules differ and can change, and nothing here guarantees passing an evaluation or meeting payout requirements.
Related guides and tools
- Run your own numbers in the Prop Firm Consistency Calculator.
- Size each trade with the Position Size Calculator and read the position size guide.
- Track losses and recovery with the Drawdown Calculator and the drawdown guide.
- Check whether a strategy has an edge in the Breakeven Win Rate & Expectancy Calculator.
- Stress-test losing streaks in the Risk of Ruin Calculator.
- Set a per-trade risk in the trading risk percentage guide and see how it fits a full plan in the risk management guide.
- Browse every topic in the guides library.
Open the Prop Firm Consistency Calculator
About the author
Mohsin Anwar, Founder & Calculator Developer of SOFTYTOOLS, writes and maintains the calculators and guides on this site, focusing on clear, formula-based explanations of trading and investing concepts rather than opinion or speculation.