
What this tool answers
Two questions come up constantly: how often does a setup need to win, and is my current win rate enough? The break-even win rate answers the first from your average win and loss. The expectancy answers the second once you add your actual win rate.
Formulas
Net win = Average win − Cost per tradeNet loss = Average loss + Cost per tradeBreak-even win rate = Net loss ÷ (Net win + Net loss)Expectancy = p × Net win − (1 − p) × Net lossProfit factor = (p × Net win) ÷ ((1 − p) × Net loss)p is your win rate as a decimal. Expectancy in R divides expectancy by the net loss.
Worked example
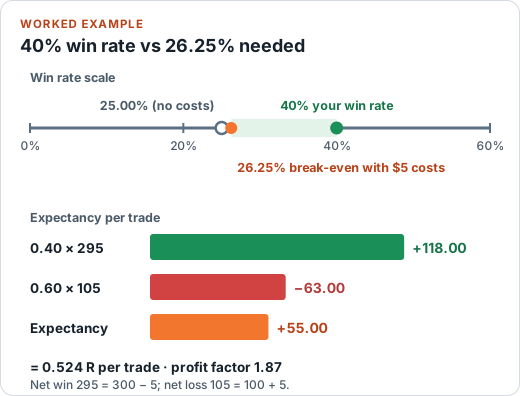
Your average winner is 300, your average loser is 100, each trade costs 5, and you win 40% of the time.
- Net win = 300 − 5 = 295; net loss = 100 + 5 = 105
- Break-even win rate = 105 ÷ (295 + 105) = 26.25%
- Expectancy = 0.40 × 295 − 0.60 × 105 = 118 − 63 = 55.00 per trade
- Expectancy in R = 55 ÷ 105 = 0.524 R
- Profit factor = 118 ÷ 63 = 1.87
Your 40% win rate sits 13.75 points above the 26.25% break-even rate. Without costs the break-even rate would be 25%, so the 5 per trade costs 1.25 points of win rate.
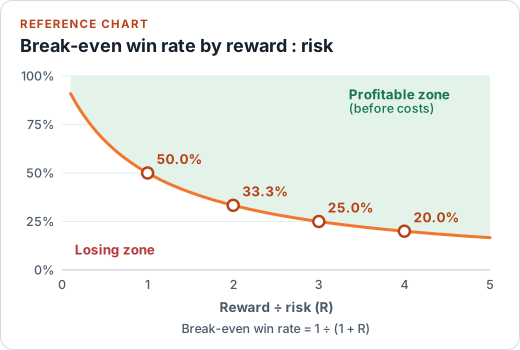
Break-even win rates at common ratios (no costs)
| Reward : risk | Break-even win rate |
|---|---|
| 1 : 1 | 50.0% |
| 2 : 1 | 33.3% |
| 3 : 1 | 25.0% |
| 4 : 1 | 20.0% |
How to use it
- Enter your average winning and losing trade in the same currency units. Use your own journal, not a hoped-for figure.
- Add an average cost per trade if you can estimate it.
- Enter your win rate to see expectancy and profit factor.
Assumptions and limitations
- It assumes every win is the average win and every loss is the average loss. Real results vary around those averages.
- It says nothing about drawdown or streaks. Use the Risk of Ruin Calculator for that.
- A positive expectancy from past trades is not a promise about future trades.
Common mistakes
- Ignoring costs, which matters most for small, frequent trades.
- Using planned reward and risk instead of average realised results.
- Judging a strategy from too few trades.
FAQ
What is a break-even win rate?
It is the share of trades that must win for your average results to equal zero. It depends only on your average win, average loss and per-trade costs. A strategy that wins more often than its break-even rate has a positive expectancy over the sample you measured.
Why does adding costs raise the break-even win rate?
Every trade pays the cost whether it wins or loses. The cost shrinks your average win and enlarges your average loss, so you need to win more often to come out even.
What does expectancy in R mean?
R is your average loss, treated as one unit. An expectancy of 0.52R means that, on average, each trade has returned about half of an average loss in profit. It lets you compare strategies that risk different amounts.
Can I trust expectancy from a small sample?
Not very far. Win rate, average win and average loss from a few dozen trades carry wide uncertainty. Treat the output as a description of the numbers you entered, not as a prediction.