
Two ways to stress a strategy
The first tool asks how often a strategy with a given win rate, reward-to-risk and risk per trade would suffer a drawdown you consider ruinous. The second asks a simpler question: if I lose several trades in a row, how deep is the hole and how big a gain do I need to climb out?
Method
Each simulated trade risks a fixed percentage of the current equity, so losses shrink and wins grow with the account. A win multiplies equity by 1 + Risk% × R; a loss multiplies it by 1 − Risk%. The simulation tracks the running peak and records ruin the first time equity is at or below peak × (1 − threshold). It runs up to 5,000 paths per scenario from a fixed seed (the count is reduced above 1,000 trades to keep the page responsive), so results repeat exactly.
After n consecutive losses: Equity = (1 − Risk%)ⁿDrawdown = 1 − EquityGain needed to recover = 1 ÷ Equity − 1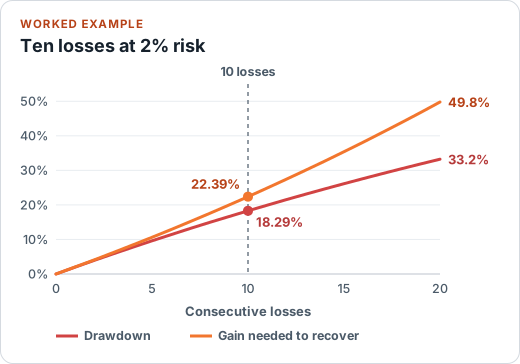
Worked example
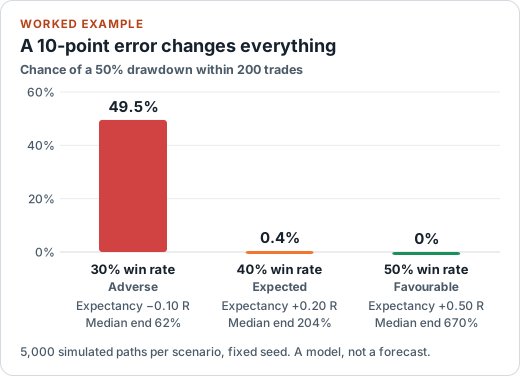
Win rate 40%, reward-to-risk 2:1, risk 2% per trade, 200 trades, ruin defined as a 50% drawdown from peak. Expectancy is 0.4 × 2 − 0.6 × 1 = +0.20 R per trade.
- Expected (40%): about 0.4% of simulated paths hit a 50% drawdown; median final equity is roughly 204% of the start.
- Adverse (30%): expectancy turns negative (−0.10 R) and about half of the paths (49.5%) hit a 50% drawdown.
- Favourable (50%): none of the 5,000 paths hit it in this run; median final equity is roughly 670%.
The gap between the columns is the point. A ten-point error in your win rate estimate moves the answer from “almost never” to “about a coin flip”. That sensitivity is more informative than any single figure.
For the streak table at 2% risk, ten losses in a row leave 81.71% of equity (an 18.29% drawdown) and need a 22.39% gain to recover. With a 40% win rate, the chance of at least one run of eight losses somewhere in 200 trades is about 75%, much higher than most people expect.
How to use it
- Enter a win rate and reward-to-risk ratio you have evidence for, ideally from a journal, not a hope.
- Set the drawdown you would regard as ruin, and the number of trades you plan to take.
- Look at all three columns, not just the middle one.
- Use the streak table to check whether your risk per trade lets you survive realistic losing runs.
Assumptions and limitations
- Trades are independent with a constant win rate and fixed reward-to-risk. Real strategies drift, cluster and change with market conditions.
- Risk is a constant fraction of current equity. Other sizing rules give different results.
- Slippage, gaps and trades that lose more than 1R are not modelled.
- The simulation has sampling error of roughly half a percentage point on the ruin figure at 5,000 paths, and more when fewer paths are used for long horizons.
Common mistakes
- Reading the result as a prediction of what will happen.
- Using a win rate measured on a handful of trades.
- Ignoring recovery: a 50% loss needs a 100% gain, not 50%.
FAQ
What does “risk of ruin” mean here?
It is the percentage of simulated account paths in which equity falls at least your chosen percentage below its running peak at some point during the trades you specify. You choose both the percentage and the number of trades.
Is this a forecast?
No. It is a mathematical scenario: given win rate, reward-to-risk and risk per trade, how often would a random sequence of wins and losses hit the drawdown you chose? Real markets don't follow fixed win rates, and your true win rate is never known exactly.
Why does the same input always give the same number?
The simulation uses a fixed random seed so results are reproducible. It runs up to 5,000 simulated paths for each scenario (fewer for very long horizons, to keep the page responsive), so small differences from the true theoretical probability remain.
What do the adverse and favourable columns mean?
They re-run the same setup with a win rate lower or higher than your expected one by the number of percentage points you choose. They show how sensitive the outcome is to being wrong about your win rate.
How is the losing-streak probability calculated?
Exactly, using a recurrence over the trade sequence rather than a simulation. It gives the chance of at least one run of that many consecutive losses within the number of trades, assuming each trade is independent.