
Why the average matters
If you buy the same asset several times at different prices, your real entry is the quantity-weighted average of those purchases, not the simple average of the prices. A large purchase at a low price pulls the average down further than a small one.
Formula
Average price = (P₁Q₁ + P₂Q₂ + … + PₙQₙ) ÷ (Q₁ + Q₂ + … + Qₙ)Break-even price = (Σ PQ + Σ fees) ÷ Σ QWorked example
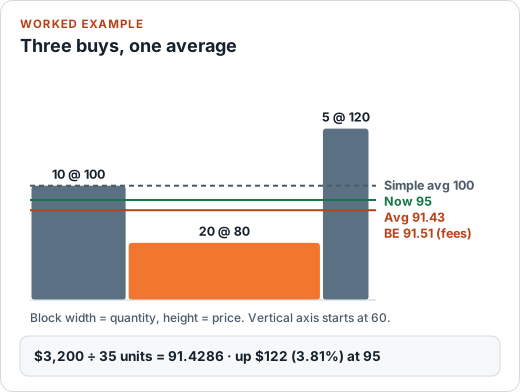
You buy 10 units at 100 (fee 1), 20 units at 80 (fee 2) and 5 units at 120 (no fee). The current price is 95.
- Total cost = 1,000 + 1,600 + 600 = 3,200 for 35 units
- Average price = 3,200 ÷ 35 = 91.4286 (the simple average of 100, 80 and 120 would be 100)
- Total fees = 3; break-even price = 3,203 ÷ 35 = 91.5143
- Unrealised result at 95 = 35 × 95 − 3,200 − 3 = +122.00, about 3.81% of the amount invested
How to use it
- Enter each purchase's price and quantity, and its fee if there was one.
- Use “Add purchase” for more rows; use Remove to delete one.
- Enter the current price to see unrealised profit or loss.
Assumptions and limitations
- Long positions only; sales and partial exits are not modelled here. See the Partial Close Calculator for scale-outs.
- Fees are the absolute amounts you enter, once per row. Selling fees are not included.
- Tax treatment of cost basis (for example FIFO or average cost rules) varies by country. This tool does not produce tax figures.
Common mistakes
- Averaging the prices without weighting by quantity.
- Treating a lower average as a reason to keep buying. A lower average does not change the fact that the asset is below your earlier entries.
- Leaving fees out when they are a meaningful share of a small purchase.
FAQ
Is this the same as dollar-cost averaging?
Dollar-cost averaging is a buying habit; this tool just calculates the weighted average price of whatever purchases you enter, however you made them.
Why is the break-even price higher than the average price?
Fees you paid have to be recovered before you are even. The break-even price spreads the total fees across all units: (total cost + total fees) ÷ total quantity.
Can I use it for short positions?
This version is built for buying and accumulating a long position. Selling short in stages uses the same weighted-average idea, but the profit sign is reversed, so the unrealised figure shown here would be wrong for a short.
What happens if I leave a fee blank?
A blank fee counts as zero for that row.